
For the moment, I’m still sending updates into IOT Plotter, but I wanted to have more flexibility (and I wanted to tinker some more, honestly).
Pico Changes…
So there have been a number of changes, additions, tidying and refactoring to the code running on the pico.
Now, on each polling run, for each temperature sensor, the pico sends a UDP multicast packet onto the network containing a JSON string. The string contains the sensor name and the current temperature.
One UDP packet for each sensor for each poll of the sensors.
What this means is that anything else around the network that is interested in the various temperatures, can subscribe to the multicast group and do as it wishes with what it receives.
I had the onboard LED come on at the start of a polling cycle and go off at the end. This gives at least a little bit of status without needing to hook up to the computer.
I also updated the bit of code that makes the API call, and had it send a multicast packet with a status update in it so there’s also an ability to do some remote debug without the need to hook up Thonny being the first port of call.
Prometheus & Grafana
I already use prometheus elsewhere for collecting metrics from various things, but in all cases I’m using existing exporters and predefined Grafana dashboards. This was an opportunity to have a go from scratch. Learn. Understand.
Prometheus Exporter
I wrote a basic exporter using the Python `prometheus_client`library.
The idea being that the exporter would:
- Run a HTTP server on a port so that Prometheus can scrape the metric(s)
- Subscribe to the multicast group and listen for the UDP packets
- Update the metric(s) with the current temperature
The resulting code can be seen in the Github repository
Whilst the code only processes the UDP packets containing packets containing temperature updates, it does log the status updates as well, and so the log file for the running service can be used to debug the current state of the IOT Plotter API calls too.
Friendlier Sensor Names
Each temperature update includes the sensor name from the configuration file on the pico. I had ensured that all of the names were formed with a capital for each new word, so Loft, LivingRoom, ColdWaterTank etc. In the exporter, I convert these into “friendly names” that are included in the updates in a friendly_name label, so the above become Loft, “Living Room”, “Cold Water Tank”.
Prometheus
Configuring Prometheus is the usual addition of a job to scrape the target. I’m running Debian, so my config file is in /etc/prometheus/prometheus.yml
- job_name: 'temperature'
  static_configs:
    - targets: ['192.0.2.100:8000']
Grafana
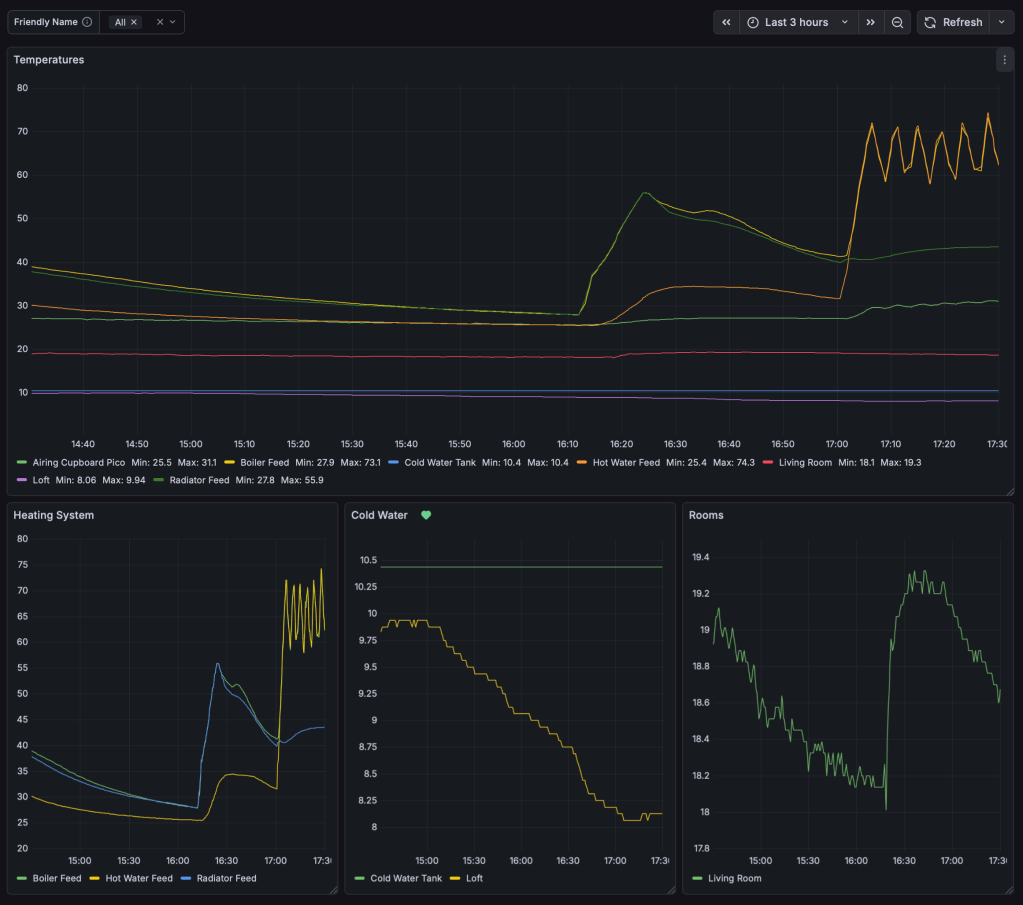
In Grafana I created a new dashboard, and a variable picker. This picker uses the friendly_name field introduced above:

The main graph then uses this, defaulting to “All”.
In the following example you can see:
- when the heating comes on, whether it’s feeding the hot water, radiators or both
- the temperature in the loft, and the water in the cold water tank
Alerts
I created an alert in Grafana that will tell me if the water in the cold water tank gets to 3 celsius so I know if it’s approaching freezing (although its a reasonable volume so won’t freeze quickly)
I also wanted to be alerted as to whether updates had stopped arriving for a sensor.
I looked at a combination of last_over_time and changes, but, particularly with the cold water tank, the temperature could be very stable for hours on end even if the updates were arriving.
So I decided to add a timestamp metric that is updated at the same time as the temperature. So, even if the temperature value doesn’t change, the timestamp, which is the unixtime value at the time of the update, will always change.
That allowed me to create an alert for a sensor on each pico (bearing in mind that some picos have multiple sensors, I don’t want to be alerted multiple times for each pico)
time() - last_over_time(
    timestamp(
        changes(temperature_last_seen_timestamp{sensor_name="ColdWaterTank"}[1m]) > 0
    )[1h:]
)
Summary
A nice thing about the design is that if you configure and plug in a new sensor:
- It’ll start multicasting temperature updates to the network.
- The prometheus exporter will pick the updates up automatically and include them for scraping.
- Prometheus will pick them up automatically the next time it scrapes.
- Finally, Grafana will see them automatically, and at least for the main graph on the dashboard, they’ll appear automatically.

Leave a comment